
Quick answer
A useful speed review starts with the page your customer is trying to use and the point where it feels slow. A large opening image, a delayed menu and a form that jumps down the screen are different problems. Keeping the page address and the action beside the test results makes it easier to ask a developer for a specific repair.
For a UAE service business, we'd begin with the route to an enquiry: opening a service page on a phone, reading enough to decide, then calling or sending the form. The review below gives you a way to describe that route and compare proposed fixes.
On this page
Describe the delay before opening a report
Try the page as a new visitor would. If you normally stay logged in, use a private window too. Note whether the first useful content appears late, whether a tap waits for a response, or whether something moves just as you try to use it.
The page address matters. A fast homepage doesn't establish how a project gallery or booking page behaves. If your site has English and Arabic versions, try the actual pages your customers use in both languages. A different image or embedded tool can change the experience.
You can send a developer a short note such as: “On the mobile maintenance-service page, the text appears, then the enquiry button moves when the gallery loads.” A screen recording can make that easier to reproduce. It also gives you a useful check after the repair.
Read the two kinds of PageSpeed evidence
PageSpeed Insights can show real-user experience data alongside a controlled Lighthouse test. The two answer different questions. Real visits show the experience collected from eligible Chrome users; a lab test helps investigate a page under its test conditions.
Google says the real-user results cover a rolling 28-day period. A small or new site may have too little data for a page, or even its whole origin. In that case, “no data” doesn't tell you whether the page is fast or slow. Look at the label showing whether the report describes this page or the origin. Google's explanation of PageSpeed data
Keep the test date and mobile or desktop mode with the result. For a useful comparison, repeat the same test conditions rather than comparing a mobile result before the change with a desktop result afterwards.
Connect the metric to the customer's task
Google's Core Web Vitals describe loading, responsiveness and unexpected layout movement. The current “good” thresholds are assessed at the 75th percentile of visits, separately for mobile and desktop. Current Web Vitals definitions
Scroll the table to see all columns.
| Measure | Good threshold | A useful question for the repair brief |
|---|---|---|
| Largest Contentful Paint, LCP | 2.5 seconds or less | Which main visible element is late, and what delays it? |
| Interaction to Next Paint, INP | 200 milliseconds or less | Which interaction is slow, and what work runs when it happens? |
| Cumulative Layout Shift, CLS | 0.1 or less | Which content moves unexpectedly, and can its space be reserved? |
A developer still needs to investigate the cause. An image might need a different delivery size; a busy interaction might involve third-party code; a moving layout might need space reserved before media arrives. The score alone doesn't choose the fix.
Google uses Core Web Vitals in its ranking systems, but good results don't guarantee a top position. Your page still needs useful content and a clear mobile experience. Google's page-experience guidance
What two real mobile reports show
We tested two websites we've built on 16 November 2026, with three fresh-browser runs for each page. The screenshots show the middle Performance score from those three runs. We used Lighthouse 13.6.0 in local Chrome, with Moto G Power mobile emulation, simulated Slow 4G and 4× CPU slowdown. These are lab measurements of the tested pages.
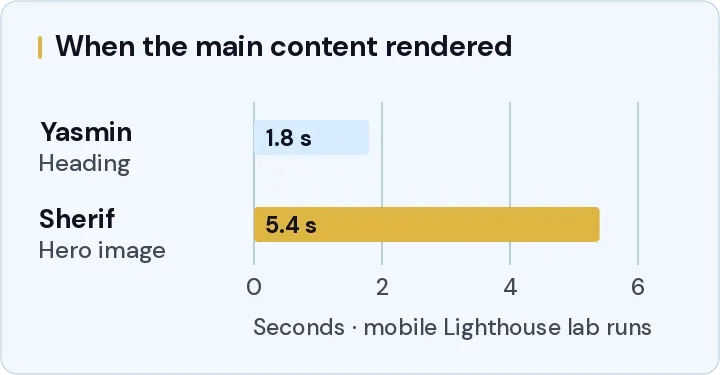
Yasmin Teimoori: a strong result with more to inspect
The Yasmin Teimoori project includes a real-estate page at yasminteimoori.com/real-estate. Its three Performance scores were 93, 99 and 98, giving a median of 98. In the report shown, Largest Contentful Paint was 1.8 seconds, Total Blocking Time was 110 milliseconds and Cumulative Layout Shift was 0.
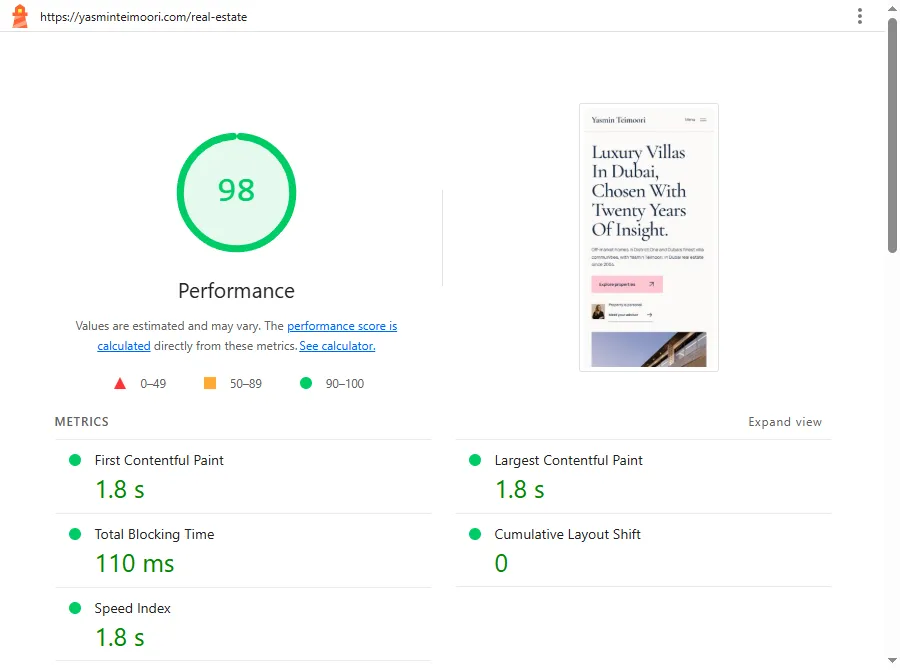
Lighthouse identified the opening heading as this page's LCP element. That detail matters when deciding what to investigate. The report also flagged image-delivery opportunities for property photographs, so there's useful work to assess even with a high overall score.
Sherif EMW: follow the element that appears late
For the Sherif EMW project, we tested sherifemw.ae. Its three Performance scores were 74, 78 and 79, giving a median of 78. The middle report recorded First Contentful Paint at 1.8 seconds and Largest Contentful Paint at 5.4 seconds, with Total Blocking Time of 110 milliseconds and Cumulative Layout Shift of 0.
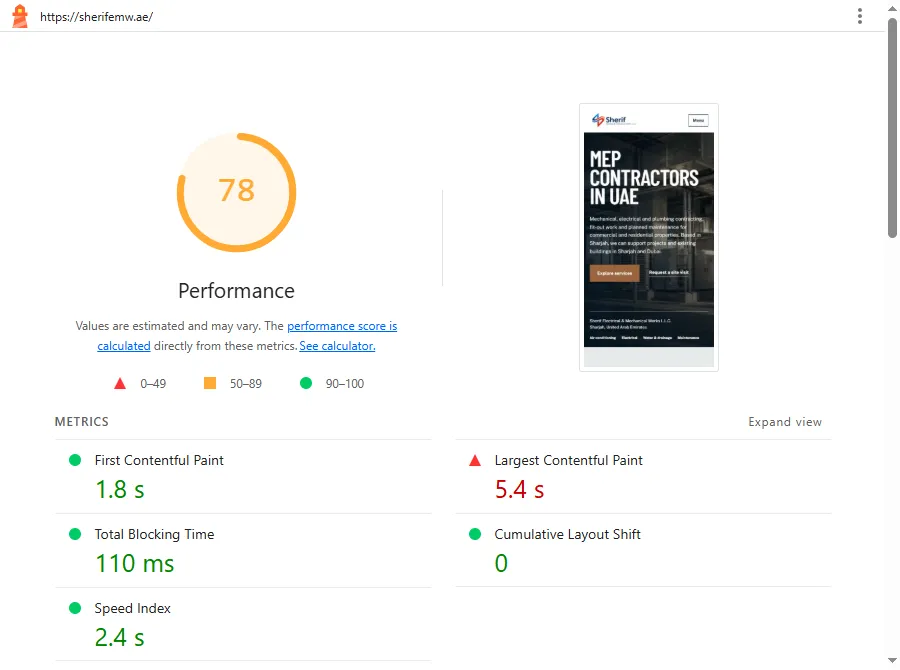
Here, Lighthouse identified the opening plant-room photograph as the LCP element. Some content appeared earlier, while that large visible element took longer under the simulated mobile conditions. We'd trace how the hero image is fetched and displayed before choosing a repair, then repeat the same page test to assess the change. The layout-shift result helps keep that loading investigation separate from content moving around.
The report also flagged a four-hour cache lifetime for images. Longer browser caching can help repeat visits. This particular audit is unscored, so the warning itself does not subtract Performance points. The effect of any caching change would need its own test, with a clear distinction between a new visitor and a returning one.
The range across the runs is worth keeping with the screenshots. Google explains why Lighthouse scores vary, and these reports don't establish real-user Core Web Vitals or an increase in enquiries. Total Blocking Time is a lab metric; it isn't an INP measurement.
Use a worked repair brief
Here's a fictional maintenance business reviewing its service page. These are example observations, rather than test results from an NST client.
Scroll the table to see all columns.
| Observation | Work to investigate | Acceptance check |
|---|---|---|
| The opening photo arrives well after the heading | Identify the image request, delivered dimensions and loading priority | Repeat the same mobile test and compare when the main content appears |
| The enquiry button moves when photos load | Check whether media has reserved dimensions | Replay the page load and confirm the button stays in place |
| The menu pauses after a tap | Record the interaction and inspect the work it triggers | Repeat the interaction on an agreed phone and check the response |
| The contact form shows success but the office cannot find the message | Trace the form through delivery and the receiving inbox | Send an identifiable test enquiry and confirm staff receive it |
That last row belongs in the review even though it isn't a speed score. A faster page still needs to deliver the enquiry. It helps to keep the technical measurement and the customer's completed task in the same brief.
Agree on the repair and the retest
Before commissioning the work, ask which pages and shared templates it affects. A gallery change may help several project pages; removing a booking script could break a useful function. Knowing those dependencies lets you agree what needs checking before release.
The proposed scope should identify the suspected cause, the change and how the team will compare the result. A screenshot of a higher score is easier to assess when it comes with the page address and test conditions. Changes to field data take time to appear in a rolling reporting window.
It's also useful to know what the work leaves untouched. If the supplier is fixing image delivery, a slow external booking provider may remain a separate item. Our website quote guide gives you a worksheet for putting these responsibilities into the same request.
Discuss the pages that need attention
We can help scope the website work around the delay you can reproduce and the enquiry route you need to preserve. See our Website Development service for the broader build and support discussion.
Send NST the page address and the problem you see, along with the phone or browser you used and any recent change to the site.
Scope the website repair
Share the page and the delay you can reproduce so we can discuss a focused repair and its checks.
Mentioned in this article


Keep reading

What changes the cost of a business website in Sharjah?
Compare website scopes, content responsibilities and running costs. Use a sample Sharjah business brief to request a clearer website quote.

A Dubai Google Business Profile checklist for service businesses
Check eligibility, service areas, profile details and enquiry tracking with a worked Google Business Profile checklist for Dubai service businesses.

What drives the cost of a mobile app in Dubai?
Compare published Dubai mobile app costs in AED, see what goes into a real design prototype, and use a checklist to scope your first release.